Why In-Person Training Is Losing Ground to Blended Learning
Traditional training sessions are losing ground. Discover why blended learning is replacing in-person training and how the Learning by Doing approach
Learn how learning analytics and a data model can optimize your LMS, close skill gaps, personalize training programs, and improve employee performance at

The most effective way to optimize employee training is to treat learning data the same way product teams treat user behavior data: collect it systematically, segment it by audience, and act on what it reveals. Learning Analytics is the discipline that makes this possible, turning raw LMS (Learning Management System) usage signals into actionable decisions about content, format, and delivery.
Netflix, Spotify, and Amazon built their competitive edge on personalization driven by data. Training departments can apply the same logic. This article explains what Learning Analytics is, which metrics matter most, how a data model can be used to optimize an LMS, and what new training models emerge when analytics are put to work properly.
Learning Analytics is the measurement, collection, analysis, and reporting of data about learners and their contexts, with the purpose of understanding and improving both learning and the environments in which it takes place. For L&D (Learning and Development) teams, it is the bridge between training activity and measurable business impact.
Data generated by employees as they use digital tools and training content is one of the most underused assets in any organization. When that data is structured and analyzed, it reveals which training materials drive behavior change, which create friction, and which are simply ignored.
"It is fundamentally different to act on your employees and their level of training than to simply measure your services."
Christophe Samson, CIO, Cdiscount and DG Peaksys, on the Lemon Learning podcast
Learning Analytics serves three distinct groups inside an organization.
Training and L&D departments use analytics to assess the root causes of ineffective software training and improve programs in terms of duration, format, and content coverage.
Business units and operational managers use analytics to understand how employees interact with business-critical tools on a daily basis. If a CRM (Customer Relationship Management) workflow generates repeated errors, usage data surfaces that friction before it compounds into lost revenue.
Finance and accounting teams use analytics to quantify the return on training investment, identifying which programs drive measurable productivity gains and which represent sunk costs.
Analyze to anticipate. Observing patterns, such as a training guide launched repeatedly by employees in the same department, or a module abandoned at the same timestamp by most learners, allows teams to anticipate problems before they affect performance. Predictive signals in training data are as valuable as they are in any other operational domain.
Analyze to personalize. Adaptive Learning, the approach that uses AI (Artificial Intelligence), behavioral data, and pedagogical design to tailor training paths to individual needs, depends entirely on quality analytics. Learning Analytics allow programs to be personalized by role, tool usage frequency, prior knowledge, or feedback history.
Analyze to engage. Visibility into employee learning habits supports a continuous feedback culture. Recognizing completion milestones, highlighting progress, and surfacing relevant content at the right moment all rely on the signals Learning Analytics provide.

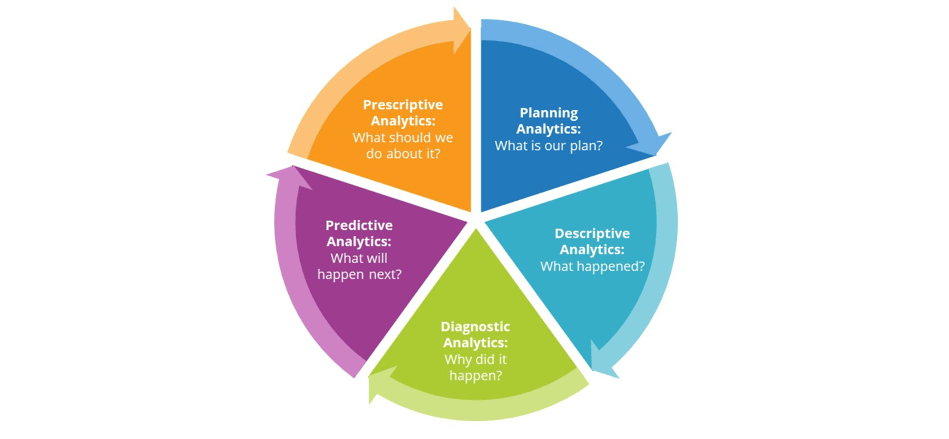
Not all data is equally useful. The goal is to identify metrics that connect learner behavior to outcomes that matter to the business. The four-level framework below provides a practical structure for moving from raw data to informed action.
| Level | What it answers | Practical example |
|---|---|---|
| Descriptive Analytics | What happened? | 45% of employees stopped a module at the same point and never resumed it. |
| Diagnostic Analytics | Why did it happen? | The module was 40 minutes long with no checkpoint; learners lost context when interrupted. |
| Predictive Analytics | What is likely to happen next? | New starters assigned to the same module are likely to show the same drop-off pattern. |
| Prescriptive Analytics | What action should be taken? | Break the module into three shorter segments with embedded knowledge checks; add in-app guidance for the hardest step. |
Within these four levels, the following metrics offer the highest signal-to-noise ratio for most L&D teams:
Identify which educational content performs best by format (video, PDF, quiz, interactive walkthrough) and which content tied to strategic business priorities (a new HR (Human Resources) platform rollout, a regulatory compliance update) is actually being engaged with. If strategically important content has low open rates, the training design, not the employee, is the first variable to examine.

A data model for LMS optimization is a structured way of connecting learner behavior signals to business outcomes. Without a model, analytics dashboards produce reports. With a model, they produce decisions.
The starting point is identifying which business outcomes training is meant to influence: faster onboarding, lower error rates, higher software adoption, reduced support overhead. Each outcome maps to at least one measurable learning signal.
A practical data model for LMS optimization follows four steps:
This iterative approach is what separates data-led learning optimization from one-time reporting. The LMS becomes a living system rather than a content repository.
Segmentation by learner population is one of the highest-value steps in any LMS data model. Which departments consistently underuse the training content tied to their primary tools? Which roles show the largest gap between training completion and actual tool proficiency? These questions cannot be answered with aggregate completion percentages alone.
When population-level gaps are identified, the appropriate response is not always more training. Sometimes the gap reflects a content format mismatch (a video-heavy course for a field team with limited screen time), a scheduling conflict, or a tool that is genuinely too complex for its intended use case. Analytics surfaces the real problem; the training team then chooses the right solution.
Data-led learning optimization is not only about measuring existing programs more carefully. It also creates the conditions for genuinely different training models that would not be viable without behavioral data.
In-application guidance. Digital Adoption Platforms (DAPs) embed training directly inside the software tools employees use every day. Rather than asking employees to leave their workflow to consult an LMS, a DAP surfaces contextual help, step-by-step walkthroughs, and push notifications at the exact moment of need. The analytics layer in a DAP captures which guides are triggered, how often, by which user profiles, and at which workflow steps, providing a far richer data signal than a standalone LMS can generate.
Adaptive learning paths. When analytics reveal that a learner has already demonstrated proficiency on a topic (through prior assessment scores or confident tool usage patterns), adaptive systems can skip that content and prioritize areas of genuine need. This respects employee time and focuses training effort where it produces the most return.
Continuous reinforcement. Rather than a single training event at onboarding or go-live, analytics-driven platforms support ongoing microlearning: short, targeted content delivered at regular intervals based on observed usage gaps. Research consistently shows that spaced repetition improves knowledge retention compared to massed practice.
Formats such as SPOCs (Small Private Online Courses), virtual classrooms, serious games, and blended learning approaches all become more effective when designed around analytics insights rather than assumptions about what employees need.
The platforms that deliver the most measurable training improvement today are those that combine a rich analytics layer with the ability to push the right content, in the right format, at the right moment, directly inside the applications where work actually happens. Lemon Learning's Learning and Development solution is built on precisely this principle, giving L&D teams both the data model and the delivery mechanism to optimize training continuously.
Training optimization is the process of using data, analytics, and feedback loops to continuously improve the design, delivery, and outcomes of training programs. It involves identifying what works, removing what does not, personalizing content to learner needs, and measuring impact on performance and business goals.
A practical example is using a Learning Management System (LMS) dashboard to spot that 45 percent of employees abandon a particular e-learning module at the halfway point. Diagnostic analytics then help identify whether the drop-off is caused by module length, content complexity, or a mismatch with the learner's role, so the training team can revise the module and re-measure completion rates.
The four levels are: (1) Descriptive Analytics, which shows what happened (e.g., module drop-off rates); (2) Diagnostic Analytics, which identifies why it happened; (3) Predictive Analytics, which forecasts what is likely to happen next; and (4) Prescriptive Analytics, which recommends actions to change the expected outcome.
A data model for LMS optimization maps learner behavior data (time on content, completion rates, quiz scores, tool-usage frequency) to business outcomes (productivity, error rates, support tickets). By segmenting this data by role, department, or seniority, L&D teams can identify content gaps, retire underperforming modules, and surface the formats that drive the highest engagement, creating a continuous improvement loop.
Traditional training sessions are losing ground. Discover why blended learning is replacing in-person training and how the Learning by Doing approach
Learn how to measure IT strategy performance using the right KPIs, dashboards, and frameworks. Practical guidance for IT leaders who want clear,...
Learn how Bruce Tuckman's five stages of team development—Forming, Storming, Norming, Performing, and Adjourning—help managers build high-performing...