You deploy. But do you know if it's actually working?
Lemon Analytics gives you full visibility into how your teams use their tools, which processes get completed, which pages create friction, and which licenses are being wasted.
Trusted by leading organizations
.png)
.png)
-1.png)
.png)
.png)
Training delivered is not the same as training retained.
Most IT and L&D teams fly blind after a deployment. They know what content was created, but not what happens next.
Measure. Diagnose. Act.
From the first page visit to the last license saved, every step of your data is in one place.
Measure real usage
Lemon tracks page visits, time spent and process completion across every application your teams use. No instrumentation, no engineering ticket.
Diagnose the friction
See which pages slow people down, which processes break halfway and which licenses are dormant. Filter by tool, population and date range.
Act on what you find
Rebuild the guide for the step that breaks. Renegotiate the licenses nobody uses. Prioritize the screens with no guide attached.
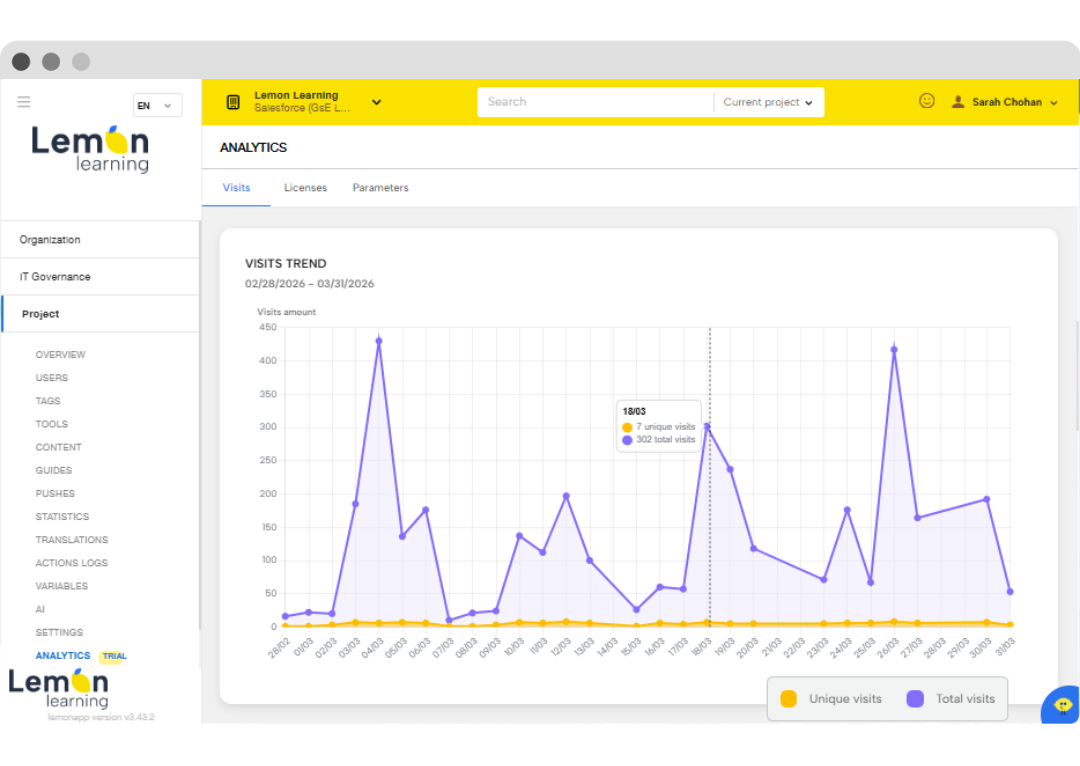
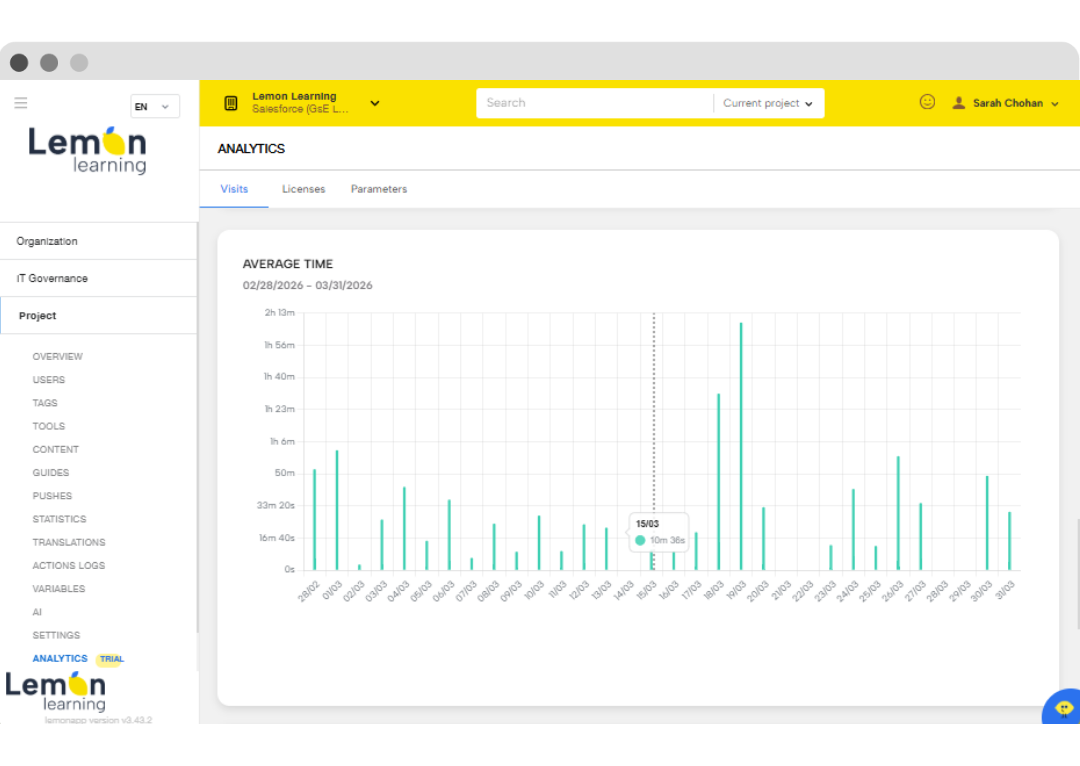
Know exactly which pages your teams visit, and for how long.
The Visits view shows you the full picture of how employees navigate your tools. Not just that they logged in, but which pages they land on, how long they stay, and how often they come back.
When a page has unusually high visit time, it often means a confusing process. When a page has almost no visits, a feature isn't being used at all. That's where your next guide should go.
- Most visited pages ranked by total and unique visits
- Average time and median time per page
- Visits trend over time, by day or by month
- Filterable by tool, population and custom date range
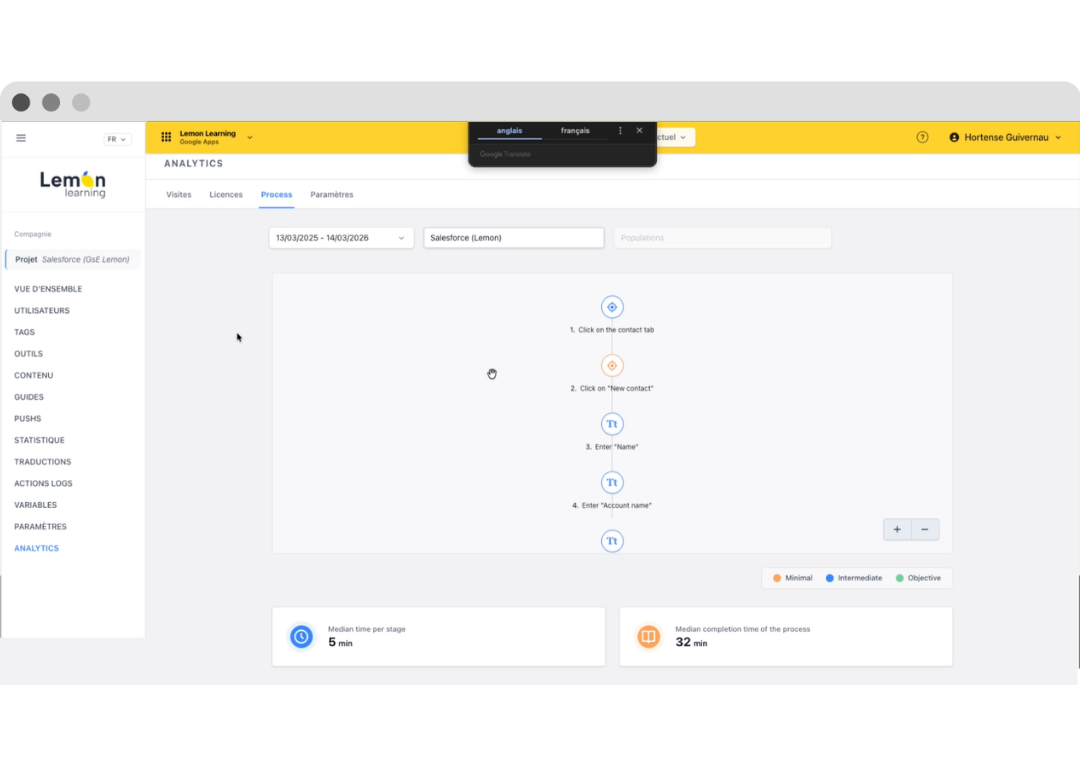
Find the exact step where employees get stuck.
Process analytics maps every step of a business workflow and shows you where employees complete it, where they abandon it, and how long each step takes. Not at a guide level, at a step level.
If step 4 of 8 has a 60% drop-off rate, you don't redo the full training. You fix step 4. That's the intelligence Lemon Analytics gives you.
- Total processes launched, completed and abandoned
- Completion rate per process over time
- Step-by-step drop-off with median time per stage
- Filterable by tool, population and date range
See which licenses are wasted. Put a number on it.
The License view cross-references your SaaS subscription data with actual usage. For every tool, it shows active users, inactive users, cost per user and the estimated annual loss from unused licenses.
That estimated loss figure is the number your finance team will care about. A concrete business case to renegotiate contracts, reallocate licenses or retire tools entirely.
- Total license cost, cost per user, active vs inactive split
- Estimated loss calculated automatically from inactive licenses
- Average engagement time by user segment
- Toggle to show or hide cost data per user role
Works on every tool
you already use.
Web, SaaS, in-house and desktop. In-app guidance lives on all of them.

Salesforce
CRM, Sales Cloud, Service Cloud, Field Service. Any org, any layout.

SAP
S/4HANA, Fiori, SAP GUI. Including legacy desktop where most DAPs stop.


Deployed at scale. Measured in results.
Three products. One goal.
Adoption creates the guides. Analytics tells you if they're working. Governance makes sure people are on the right tools to begin with.
In-app guidance
Step-by-step guides, tooltips, push messages and contextual help directly inside your business software.
- No-code editor, up in 3h
- 300+ applications
- Segmentation by profile and role
- Multi-language translation (any language)
Application governance
Shadow IT, unused licenses, compliance. Take back control of your software ecosystem.
- Automated Shadow IT detection
- Redirect to approved alternatives
- GDPR & application security
- Deploy in 48h, no new infrastructure
Lemon Analytics FAQs.
How long does it take to deploy Lemon Analytics?
Tracking starts the day Lemon is installed. A full deployment across multiple apps typically takes 2 to 4 weeks. No engineering team needed.
Do I need engineers to set up the analytics?
No. Lemon captures usage automatically once installed. No code changes, no API integration, no engineering ticket.
Which applications can Lemon Analytics track?
300+ applications including Salesforce, SAP, Workday, Dynamics 365, ServiceNow, ChatGPT and Microsoft Copilot. Lemon also tracks your in-house web apps and desktop tools.
How is Lemon different from Pendo or Heap?
Pendo and Heap track usage of a single product. Lemon Analytics tracks usage across every business app your teams touch, including SAP GUI, Salesforce, in-house tools and desktop apps. Built for internal IT and L&D, not product teams.
Is Lemon GDPR compliant? Where is data hosted?
Yes. Lemon is GDPR-compliant by design, hosted in Europe, with no exposure to the US Cloud Act. Decisive for public sector, finance and healthcare deployments.
Does Lemon support multiple languages?
Yes. You write the guide once, translate it into 5 core languages (EN, FR, ES, PT, IT) with AI, and your country leads validate. The same source content reaches everyone in their own language.
Stop guessing. Start measuring.
In a 30-minute personalised demo, we show you what your tool usage actually looks like, which processes drop off, and what your inactive licenses are costing you.
Book a demo